
Browse Data and Analysis
Filter
Search Data and Analysis
- 19 results found
- (-) Tree Nuts
- (-) Cotton
- (-) Wheat
- Clear all
Since USDA first established a stand-alone mission area focusing on trade and international affairs in 2017, USDA’s Trade and Foreign Agricultural Affairs and the Foreign Agricultural Service have made significant trade policy advances to support U.S. agriculture. This series of commodity fact sheets highlights the many recent trade policy advances achieved by USDA.
U.S. agricultural exports are a critical source of farm income. The USDA Economic Research Service estimates that on average 23 percent of the output of nonmanufactured agricultural products were exported between 2013 and 2022.
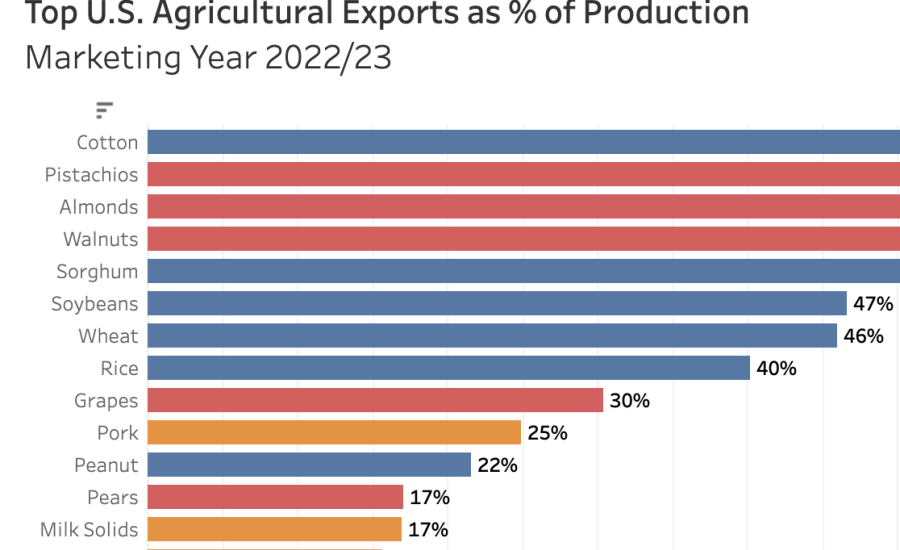
Interactive Tableau visualization showing the percentage of exported agricultural production for 25 top commodities.
The 2021 U.S. Agricultural Export Yearbook provides a statistical summary of U.S. agricultural commodity exports to the world.
A look at how U.S. agricultural exports performed in 2020.
The 2020 U.S. Agricultural Export Yearbook provides a statistical summary of U.S. agricultural commodity exports to the world. This summary lists only the United States’ primary trading partners.
On February 6, 2020, the State Council Tariff Commission announced that China would cut in half the additional tariffs for certain commodities from the United States on February 14, 2020.
Mexico is the second-largest export market of agricultural products from the United States. Over the last decade, U.S. agricultural exports to Mexico grew 48 percent to $19.1 billion.
On August 23, 2019, the People’s Republic of China’s Ministry of Finance (MOF), State Council Tariff Commission (SCTC) announced new tariffs on certain U.S. products, valued at $75 billion USD.
Graphic showing the percentage of U.S. agricultural production which is exported overseas. All told, more than 20 percent of U.S. agriculture is exported.
Bar graph showing the top U.S. agricultural exports in 2017. Soybeans was the highest at $21.6 billion, followed by corn and tree nuts.
Several categories of U.S. food and agricultural exports to South Korea saw significant growth in fiscal year 2017 (Oct/Sept).